
Key Results:
With the transition from marketing arts to the science of marketing—many companies struggle to get insights early enough in the funnel to make critical changes down the line. And the ROI is hard to find if you have to build out a team of engineers and data scientists to analyze every inch of data your business is tracking.
As the team at Instructure considered their options to get a better view and understanding of their marketing and sales funnel data—to drive a better customer experience and optimize every employee’s efforts —they found Align BI. And with their new partnership, Align BI built Instructure a new database—and from that database, a series of dashboards—illuminating critical areas of the customer journey.
With correct data organization, Align BI also delivered better data visualizations for unique insights—driving action for the Instructure team.
Now, sales and marketing at Instructure has a complete view into every lead, customer, marketing channel, and content asset—helping them drive change, reallocate budget, and identify ways to optimize the customer journey.
The Challenge
- It was time consuming to gather data
Before Align BI, the marketing team at Instructure had a marketing database, but the data was inconsistent and only one person knew the queries to try and improve or update it. It was difficult to gather insights into what marketing dollars were working versus those that weren’t effective. “Not only could you not ask those deep questions, it was really time intensive,” said Joanna Funkhauser, SVP of BI and Operations at Instructure. - Current attribution models weren’t set up for success
Prior to going private, Instructure had five employees dedicated to working on attribution modeling. With a set-it-and-forget-it strategy, the team was left with decaying attribution models. “And the second we changed our system infrastructure, it broke the models. We were dealing with a completely disjointed system,” said Joanna. - They needed new data to understand the new customer journey
The other critical challenge Instructure faced was the customer lifecycle. Previously, they dealt with a very linear customer lifecycle. The business marketed to their customers, closed deals, helped each customer be successful, and then moved on to a new customer. But after multiple acquisitions, the customer lifecycle isn’t linear anymore. “We needed to accommodate not only what’s the optimal past, but what’s optimal for the future,” said Joanna. - It was challenging to use the report data for anything actionable
Using the report data wasn’t just time intensive for the people tasked with creating the report, it was time intensive on the people that were performing the actual execution. “One of the things you never want to do in operations is disrupt the engine. We want to sit on the sidelines and gather as much information as possible so we can call out the plays,” said Joanna. It was difficult for her operations team to execute without clean data.
And with data inefficiencies, the marketing team was spending too much time focused on gathering information—how they were reporting, how the dollars were doing, justifying the work they were doing—as opposed to doing the work they actually needed to do. - They needed a solution that could match their current maturity
The team needed a solution that could meet them at their current level of maturity. “Any time you invest into actually getting insights into the funnel, it’s critical that that intelligence is based off of the company’s level of maturity,” said Joanna. “And the earlier you can get in front of these insights, the better.”
Considering the options for building a dashboard or platform in house versus working with an outside vendor, Joanna used a content recommendation engine in her analogy. “Using AI to tell you exactly what content you need to generate and what’s resonating and what’s working is a great action. But if you don’t have enough writers to supply enough content to build the AI engine, you can’t leverage the technology for what you need today.” - Internal resources weren’t enough to rebuild the database
With the operational efficiencies that their parent company was trying to solve, Joanna could see how important it was to pull in experts to work on specific projects as opposed to staffing up an entirely new team. They knew they needed a deeper dive on marketing attribution. “We knew in order for us to be effective at customer marketing, to be effective with how we spend our money and to achieve our financial targets, that we needed experts in this area.”
The team knew they needed experts to help them build what they needed without tying up internal resources. “Augmenting marketing data intelligence, with the right level of sophistication, is so much easier and more adaptable with an external team than it is with building it in house and trying to stand it up on your own,” said Joanna.
The Solution
- Customized, easy-to-read dashboards
“Overall, Align BI has brought to us the ROI and the effectiveness of their marketing engine,” said Joanna. With fully customized, easy-to-read dashboards, Align BI has brought Instructure out of the data haze of the past. Now, the team understands if they’re spending money in the right areas that will have the highest ROI—offering the biggest bang for their buck. - Accountability for specific areas of the business
Now the marketing team has specific sections of accountability. Each leader is held accountable for a certain amount of ROI—bookings contribution, pipeline generation, pipeline acceleration, and more. “And now we can actually measure it and hold people accountable for it.”
“I think that a lot of people will take dashboards and see that the insights are great. But unless it’s literally driving somebody to do something they’re accountable for, it won’t have lasting stickiness,” said Joanna. - Better forecasting for faster results
Understanding the time between funnel stages is helping the team better forecast when to expect results and which activities they can do to progress prospects more quickly. Insights on conversion rates and what assets and channels are performing are helping drive the marketing decisions for the team’s spending today and tomorrow. - A better way to budget marketing spend
And the team is budgeting for the new year in a completely new way. As opposed to flatlining everything—as many companies do—and allocating the same budget across the board to different marketing tactics, they’re able to go several steps further and assess which areas are actually working. For example, if the data shows that the paid search efforts aren’t trending upwards anymore, the team can be proactive in funneling the spend into the areas they still see working.
“We can tell that we’re going to need to invest differently in marketing in the next year. That’s because the mix is changing and we need to get in front of it. And with our Align BI dashboards, we can,” said Joanna. - Improved productivity for internal resources
Now, with the new Align BI database and dashboards, the team isn’t wasting time trying to gather new information or build a report. “It’s about how you’re maximizing the productivity of your resources,” said Joanna. “You want to maximize your revenue potential and minimize your attrition risk. At the end of the day, you want those things and you want to delight your customers.”
Results and ROI
Even with past dashboards that had good data, the team had to dig and create new views to understand what channels were working vs. those that weren’t. “We really wanted to highlight what channels were working vs. what channels weren’t performing,” said Joanna.
Now, with the new Align BI database, they can use the funnel dashboard to easily compare how a single channel, asset, or campaign funnel is performing compared to the overall funnel for the group.
At different times during the quarter, the team is looking for different solutions. Near the beginning of the quarter, the team might have the luxury of spending marketing dollars in the highest converting channels. But as they near the end of the quarter, depending on where they sit against their goal, there might be a need for a quick win that will convert and accelerate the pipeline or short sales cycle.
“It’s not always the same lever you want to pull. If it was, a lot of us would be out of jobs. It’s the knowing what to do and when to do it that can help you stay on track,” said Joanna.
WIth the new Align BI dashboards, the team can see early indicators and make real-time decisions to course correct.
For public companies, there’s huge value in predictability. Understanding those early signs and what that means for your marketing spend can tremendously impact your bottom line.
With one acquisition, that predictability wasn’t clear. Once the team could see they wouldn’t hit their goals with the current acquisition of marketing spend—by using their new Align BI dashboards—they were able to turn up specific parts of the marketing engine to make adjustments. “Then we had the lead indicators to go from a bookings deficit to exceeding plan.”
Conclusion
Overall, Align BI helped the Instructure marketing team rebuild their entire customer marketing database and glean impressive insights from new dashboards, customized to their specific needs. Using Instructure’s customer database and visualization tools, the solution can grow as the business grows. The insights aren’t tied to new software, they’re scalable and actionable. Now, the team can gather insights in real-time, make data-driven decisions, and build a targeted, personalized customer experience
“We don’t want people spending their time putting out fires. With Align BI, we can have a mission control. Our people can come in and see exactly what they need to do that day so we can build a better customer-driven experience.”
Dashboard Samples
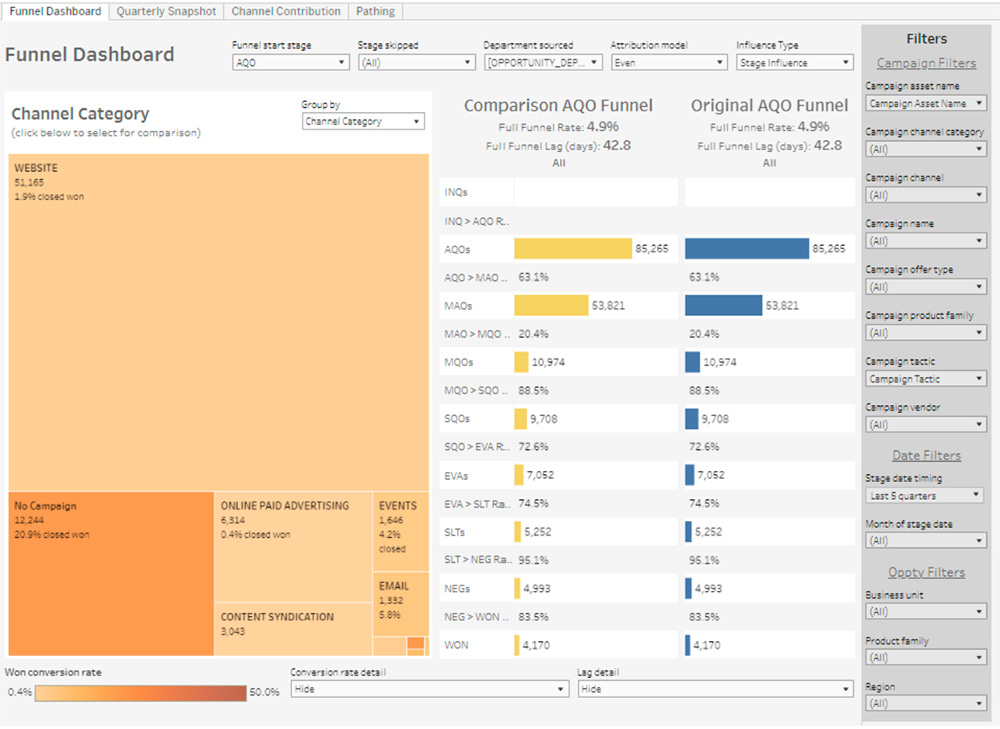
Funnel dashboard
The funnel dashboard allows marketers to see what content, channel, or campaigns are driving opportunities to and through the funnel. Marketers can compare a category within a group (e.g. online paid advertising vs. all channels) by clicking into the tree chart. The yellow funnel is filtered for comparison against the all up funnel in blue.
The funnel dashboard answers questions about what is performing best and shows conversion rates and time through the funnel.
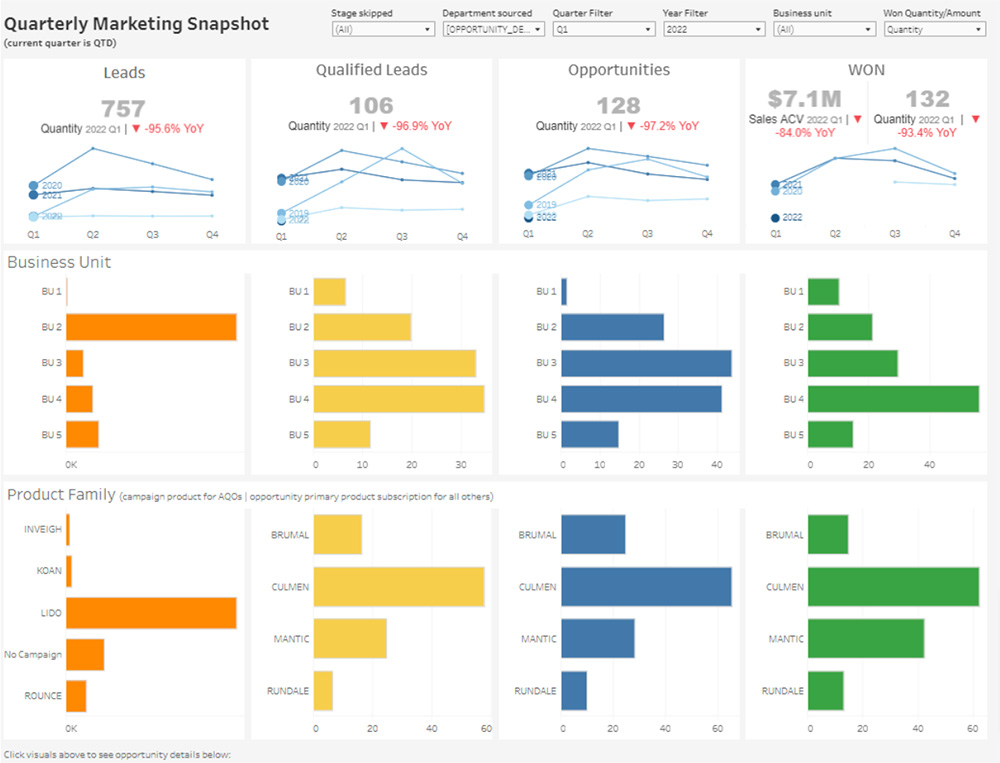
Quarterly marketing snapshot dashboard
The quarterly marketing snapshot dashboard visualizes the major funnel stages and how those stages are performing against target by specific geographic location, product, or business unit.
The quarterly marketing snapshot dashboard answers questions about how well your team did against targets in the funnel during the quarter.
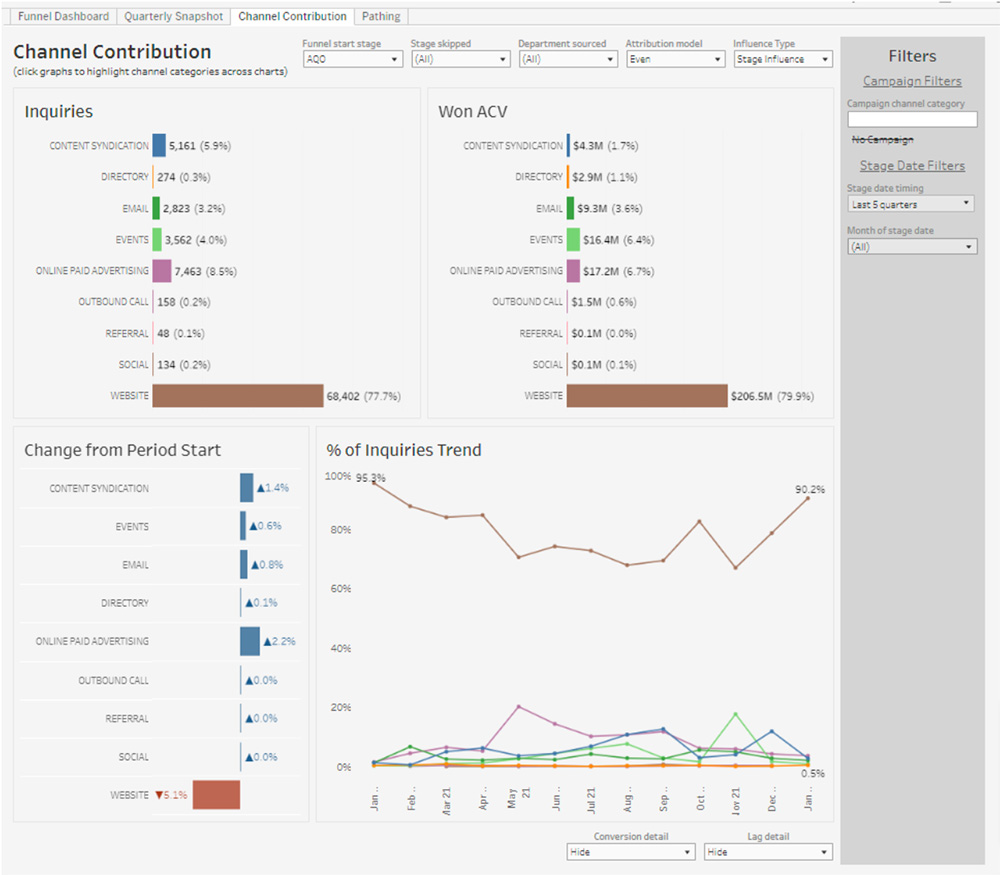
Channel contribution dashboard
The channel contribution dashboard offers a standard channel attribution view that allows you to see where leads and won business are coming from specifically. Switch between several rules-based attribution models for different views.
The channel contribution dashboard answers questions about what marketing channels are getting the most credit.
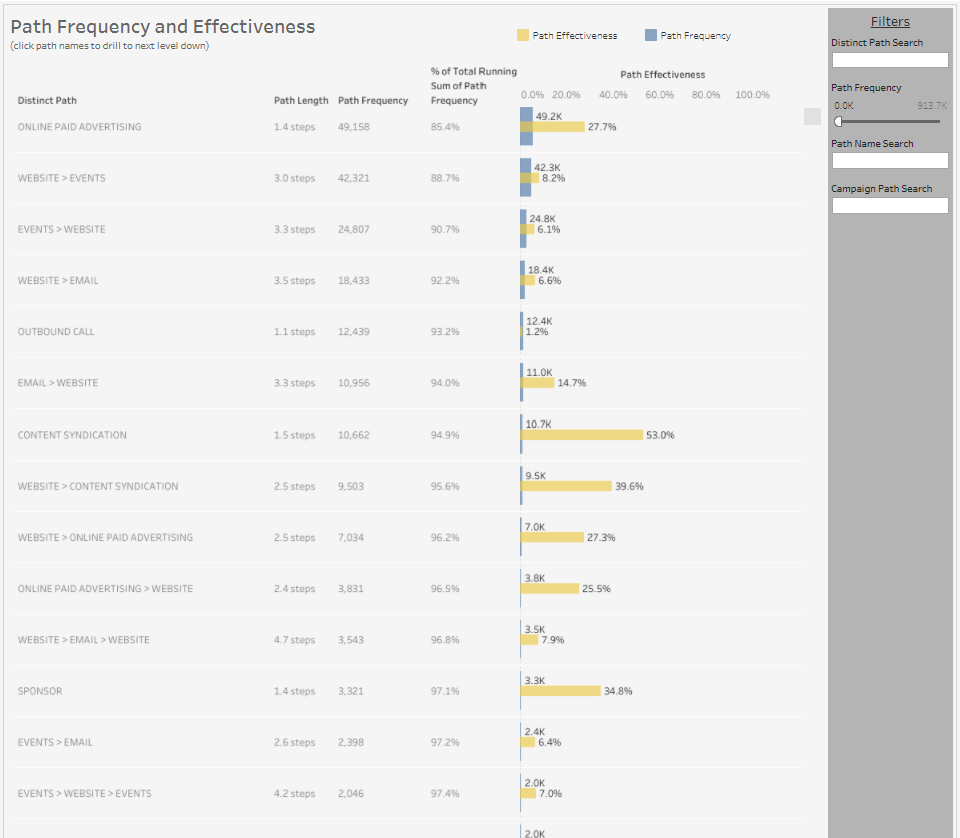
Path frequency and effectiveness dashboard
The path frequency and effectiveness dashboard is designed to help you identify the typical and most effective paths into and through your funnel.
The path frequency and effectiveness dashboard offers insight into what pairs and orders of activities are effective when prospects engage before conversion.
Align BI can help your business, too.
Get a customized marketing database with Align BI. We’ll help you organize your marketing data so you can get faster, better funnel insights and make data-driven changes for real results.
With Align BI, you can:
Organize your marketing and sales data — With a customized, built-just-for-you database, using your customer information, your data will be organized, easy-to-use, and centralized for faster access.
Get faster and better insights — See the most effective paths to opportunity creation and close with better, faster, and clearer insights into every stage, every asset, and every channel.
Optimize your marketing decisions — Find ways to optimize your marketing using models and engaging data visualizations that can help you leverage your newly organized data.
Let’s talk. Contact us to learn more about our framework for data strategy success.